Plugin development for Grafana

Grafana is an open-source platform for monitoring and observability maintained by Grafana Labs. A major contributor of Grafana’s success is the ability to integrate it into any tech stack. This is possible through a plugin platform where anyone can develop their own integrations.
The support for plugins was introduced back in Grafana 3, but due to limited documentation and examples, only a handful plugins were available—built by tinkering trailblazers. When I joined Grafana Labs, the team had already begun migrating Grafana from Angular to React, which in turn also meant releasing a new React-based plugin architecture in Grafana 7.
Getting started with plugin development
To develop a plugin with Grafana, you needed to understand not only the code to write, but how to set up your Grafana environment for plugin development. The first thing I did was to publish a set of tutorials for getting started with plugin development.
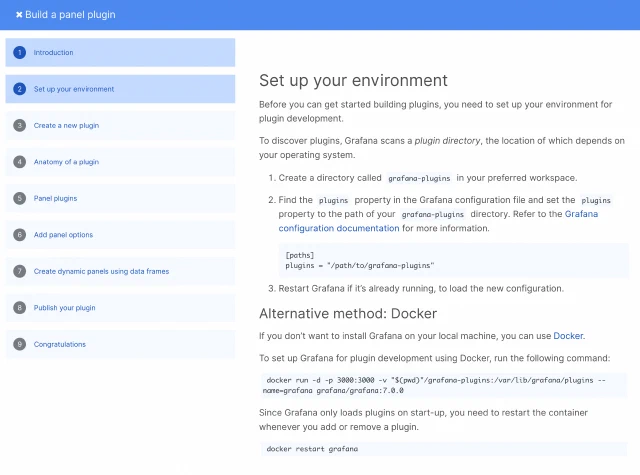
By documenting the steps to start developing plugins, the plugin platform became accessible to a wider number of developers. As a result, we started getting more questions from developers who wanted to do specific things in their plugin. To help these developers and to understand the issues they faced, I realized I needed to develop and publish a plugin of my own.
Empathy through expertise
One of the most popular plugins at the time, was the Carpet plot plugin. Unfortunately, the plugin was no longer maintained, and had several great suggestions by community members on how to improve it.
I rewrote the plugin for the new React-based platform and published it as the Hourly heatmap panel, along with an announcement post.
At the time, Grafana had limited support for creating the actual visualization in panel plugins. Fortunately, D3.js is a light-weight JavaScript library that gives developers a lot of freedom to create a wide range of interactive data visualization.
Using D3.js in a React app wasn’t necessarily straight-forward however, so I wrote How to build a scatter plot plugin in Grafana 7.0 where I distilled my learnings from writing the Hourly heatmap into a step-by-step tutorial.
During my time at Grafana Labs, I built and maintained several different plugins, each one designed to showcase different parts of the plugin platform, while simulaneously addressing the needs of our end users.
- JSON API data source (later donated to @grafana)
- CSV data source (later donated to @grafana)
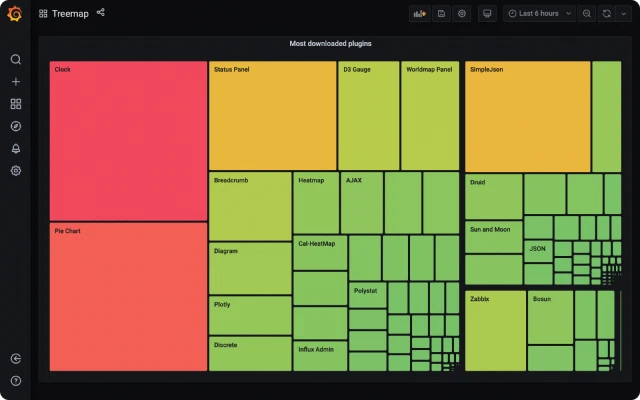
- Treemap panel (later donated to @grafana)
- Dynamic text panel (later donated to @VolkovLabs)
- Calendar panel (later donated to @VolkovLabs)
- Static data source (later donated to @VolkovLabs)
- Gantt panel (deprecated due to limited adoption)
- Hexmap panel (deprecated due to limited adoption)
I also developed the Orbit data source along with a video for Getting started with the Orbit data source for Grafana. Floor Drees later published a blog post on our collaboration for the plugin.
🏆 As an added bonus, three of my plugins would end up among the top 5 most installed plugins on Grafana Cloud.
Plugin review process
Having written several plugins myself, I had gained a deep understanding of what it takes to develop, publish, and maintain a plugin for Grafana.
By this time, I had also been reviewing plugin submissions from the community, and I started to notice some trends. Several plugin developers ran into the similar issues.
I went on to create the Grafana Plugin Validator, as well as a GitHub Actions workflow that community members could add to their plugin to increase their chances of having their plugin approved.
I published 6 tips for improving your Grafana plugin before you publish with the intention of reducing the time it took to review a plugin.
By this time, I had turned myself into a bottleneck—I could no longer keep up with reviewing the increased number of plugin submissions. I knew that I had to introduce more team members to reviewing plugins.
Using my experience reviewing plugins, I went on to become a stakeholder in rolling out a self-serve submission process based on Zendesk, that allowed us to onboard more reviewers and to measure each part of the submission process.
Moving on to advanced users
More team members were now reviewing plugins, which freed me up to work closer with our more experienced plugin developers on our community forums. At this point, our documentation covered most of what an aspiring plugin developer needed to build and publish their own plugins.
I started writing a series of forum posts catering to more advanced plugin developers who wanted to take their plugins to the next level.
- Data frame design: Basics
- Guiding panel users with a wizard
- How to use template variables in your data source
- How I use Docker for plugin development
- How to subscribe to Grafana application events
- How to add a resource handler for your data source
- How to display custom stats for your data source queries
- How to configure dimensions for your panel plugin
- How to instrument your backend data source
- How to make user-configurable HTTP requests from your data source plugin
- How to migrate from BackendSrv.datasourceRequest() to BackendSrv.fetch()
By posting these on the community forum rather on the blog, it allowed community members to ask questions and to share their own tips and tricks.
By now, Grafana Labs had created a dedicated team to work on the plugin platform and Developer Experience around plugin development. This let me focus on engaging more with community members.
In addition to speaking at meetups, I also set up office hours where individual plugin developers could schedule 30 minutes with me to talk about anything related to plugin development. Many plugin developers were developing in-house plugins and couldn’t share details in a public setting. This allowed me to help them while gathering more insights about how our users developed plugins.
Measuring success
In the early days, measuring the success of the plugin platform was difficult due to the lack of data.
That changed when Grafana introduced the plugin signing process as part of a greater focus on securing plugins. Developers now needed to create a cryptographic signature for their plugin before they could distribute it.
These requests for signatures gave us insight into how many people were developing plugins, and became the basis for our definition of Monthly Active Users (MAU). I was now able to set up a dashboard that visualized month-over-month growth of plugin developers which greatly informed company efforts into plugin development going forward.
Looking back
During my time at Grafana Labs, I had a blast forging a bond between Grafana Labs and the community of plugin developers. My journey also highlights how I prefer to engage with the community to understand gaps in the Developer Experience, addressing key issues, and then creating processes and educational resources to systematically make myself redundant.